
How to Shorten Your Sales Cycle: Where Deals Actually Lose Time
Written by: Mike Carroll

Quick Answer: A pipeline that looks full on paper can still destroy a quarter. The problem is usually shape, not size. When all the weight sits in a few large deals at the bottom of the funnel with nothing feeding in at the top, the math looks fine until it doesn't. Healthy pipeline flow means consistent new activity at the top, steady movement through the middle, and reps who disqualify bad fits early because they can afford to.
Key Takeaways
- The number most teams quote blends wins and losses together, which makes it close to useless for planning.
- Losing deals take longer than winning ones. A cycle that keeps stretching usually means qualification is getting worse, not that buyers are getting slower.
- Most of the lost time sits in one stage, and it's almost always earlier in the process than anyone expects.
- Follow-up cadence isn't the lever. The deals that drag are the ones that entered without a real reason to buy.
Why Is Your Sales Cycle Longer Than It Should Be?
Because the number includes deals that were never going to close.
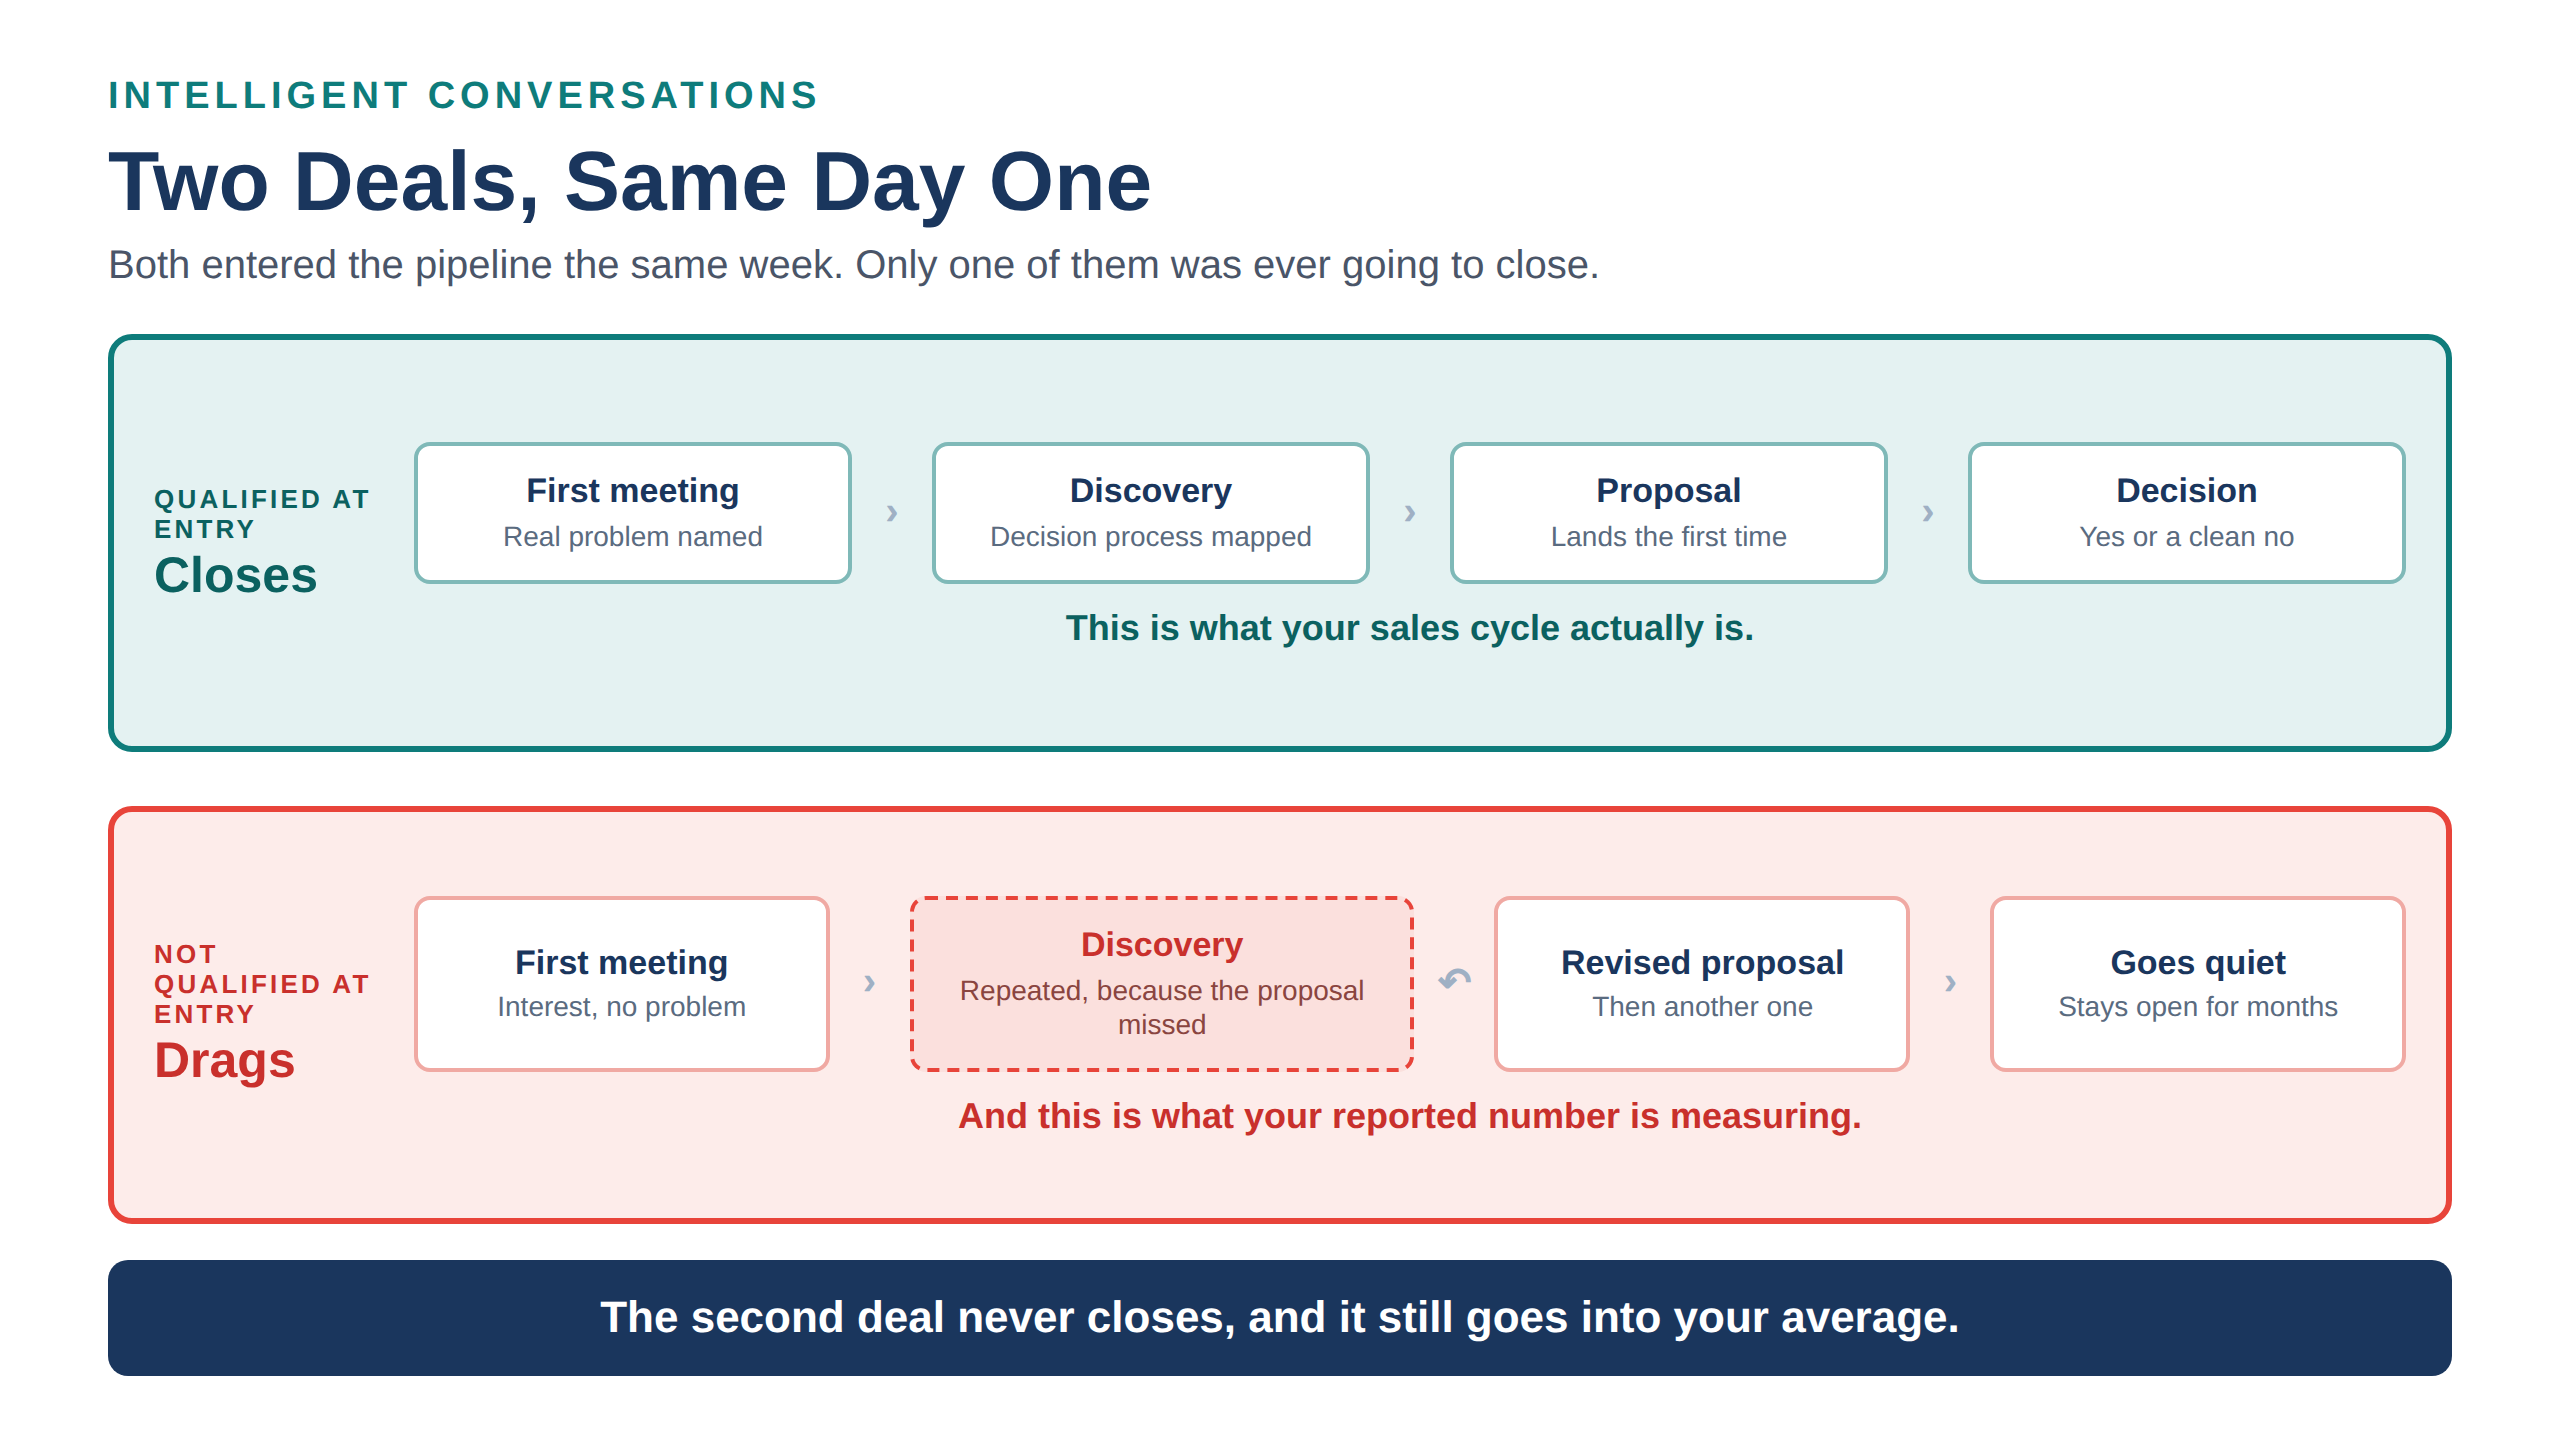
When a team says the sales cycle runs ninety days, that figure is usually an average across everything that passed through the pipeline. Deals that closed fast sit in it next to deals that wandered for months and then went quiet, and those two populations behave nothing alike.
Deals that end in a loss almost always take longer than deals that end in a win, because a buyer who isn't going to buy rarely says so out loud. They go quiet, they reschedule, they ask for one more version of the proposal. A salesperson who can't afford to lose that deal keeps it breathing, and every week it stays open it pulls the average up.
So a lengthening cycle often isn't a signal that buyers have slowed down. It's a signal that more of the wrong deals are getting in and staying in.
|
The usual explanation |
What's generally happening |
|---|---|
|
Buyers are taking longer to decide |
More deals are being worked that were never going to close |
|
The team needs better follow-up |
The team needs better qualification at the point of entry |
|
Procurement is slowing everything down |
Nobody mapped the decision process in the first meeting |
|
The market got harder |
Same market, thinner discovery |
Each row on the right is fixable. Each row on the left leads somewhere unproductive, usually to more activity aimed at deals that were never going to pay for it.
Lagging Indicators in Sales: Why Your Revenue Number Is Lying to You covers the broader version of this problem, where the number everyone watches confirms trouble months after the behavior that caused it.
How Do You Measure Sales Cycle Length So the Number Means Something?
Split it apart before you quote it.
A single blended figure hides everything worth knowing. Four changes make it usable:
- Separate won from lost. These are two different numbers describing two different behaviors, and averaging them together buries the one that matters. A won-deal cycle tells you how fast your process actually works. A lost-deal cycle tells you how long the team holds on to deals it shouldn't.
- Use the median rather than the average. One eighteen-month deal distorts a mean badly enough to make the whole figure meaningless, and most pipelines have at least one.
- Segment it. By deal size, by lead source, by salesperson. A cycle that looks stable overall can be hiding one segment that doubled.
- Start the clock in the same place every time. First meeting, not first touch, and applied consistently. Teams that measure from first touch end up measuring marketing's follow-up speed rather than the sales process.
Once it's split, the question stops being "how long is our cycle" and becomes "which of these numbers is moving, and why." The second question has an answer.
Where in the Process Does the Time Actually Go?
Look for the stage where deals sit longest, not the stage where most deals die.
Those are two different diagnostics, and most pipeline reviews only run the second one. Knowing where deals die tells you where the process breaks. Knowing where deals sit tells you where the time is being spent, and the two are rarely the same stage.
Time tends to disappear in two places:
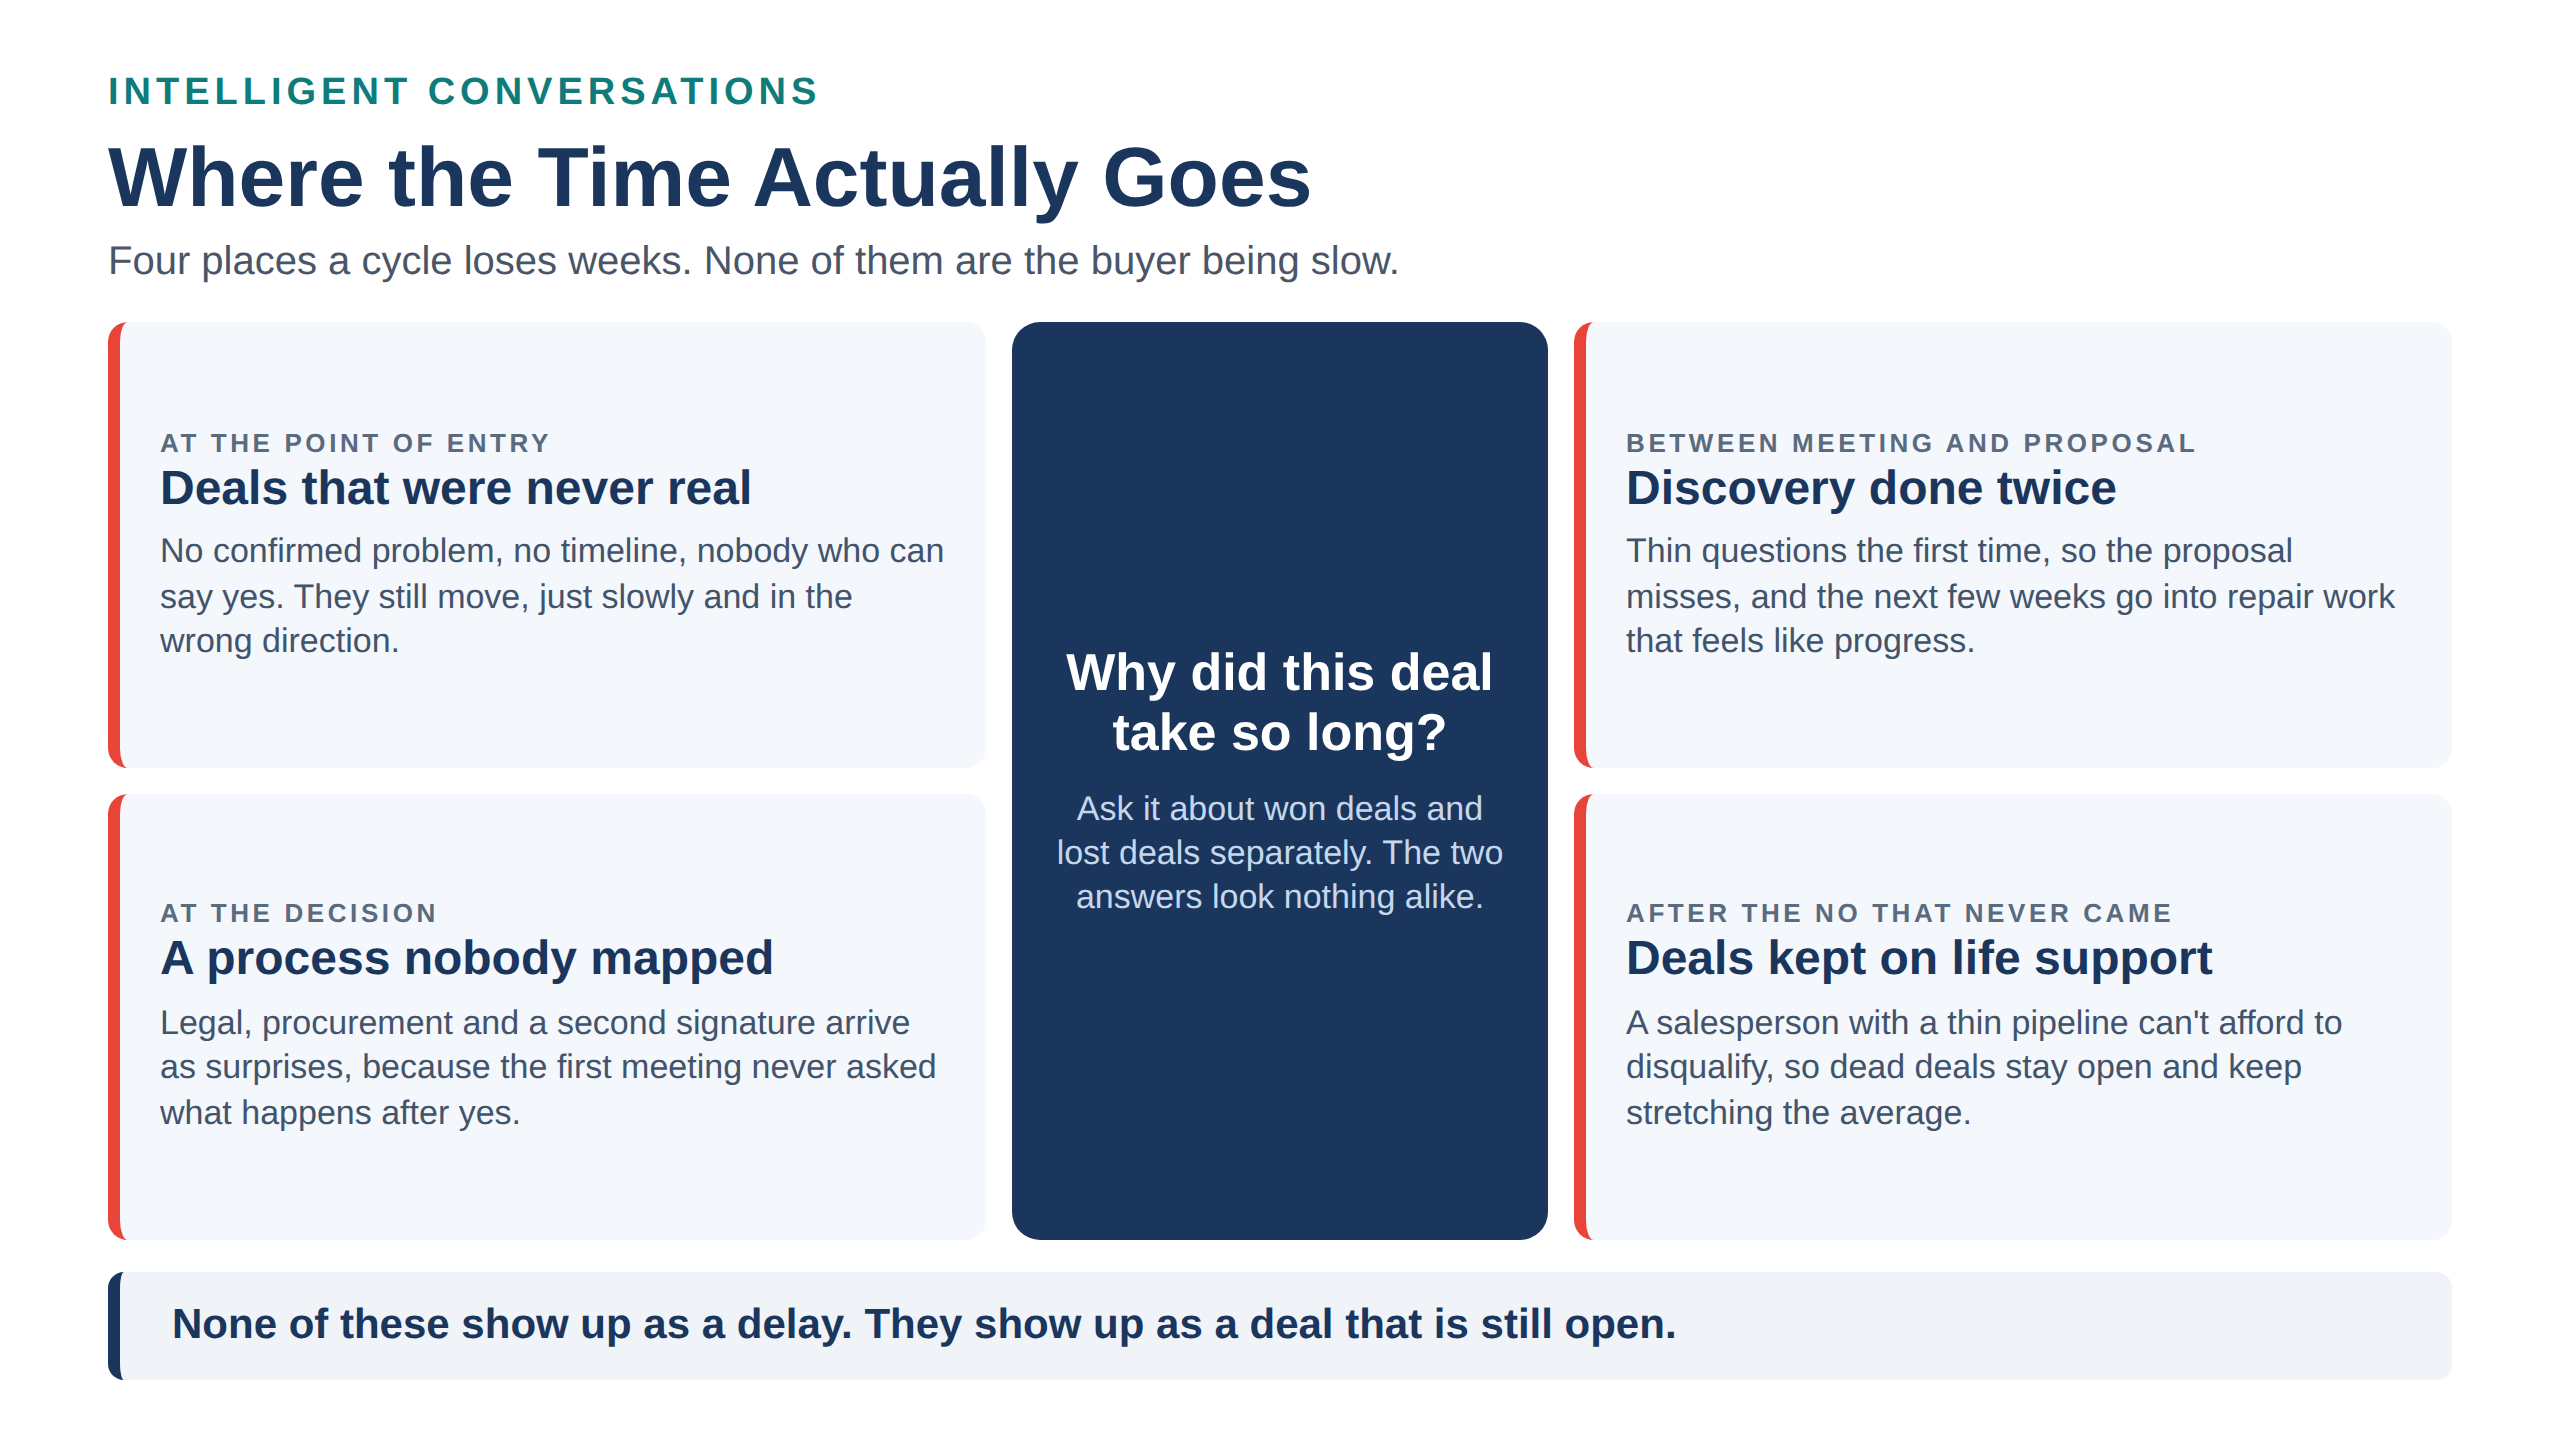
At the point of entry. A deal that enters without a confirmed problem, without a timeline, and without anyone who can say yes will consume months before somebody admits it was never real. The opportunity count looks healthy the whole time. Nothing about the stage history gives it away, because it does move, just slowly and in the wrong direction.
Between the first meeting and the proposal. When discovery was thin, the proposal doesn't land, and the weeks that follow go into redoing the conversation that should have happened at the start. The calendar fills with meetings that feel like progress and function as repair work.
Neither pattern is visible in a revenue report, and neither is reliably visible from a ride-along either. What Your Sales Manager Sees vs. What the Data Says covers why observation alone can't separate a skill gap from a belief gap, and what to pair it with.
What Actually Shortens a Sales Cycle?
Better questions earlier, and the willingness to end deals sooner.
|
What works |
What only looks like it works |
|---|---|
|
Qualifying the decision process in the first conversation, including who signs and what happens between yes and a contract |
More follow-up touches, which add activity to a deal that was already going nowhere |
|
Disqualifying early and out loud, so the time goes to deals that can close |
Urgency and deadline pressure, which buyers recognize and discount accordingly |
|
Keeping enough new opportunities coming that walking away from one is affordable |
Discounting to force a date, which shortens this cycle and lengthens every future one |
|
Coaching one stage at a time until the change holds under pressure |
Faster software, which moves the same deals through the same stages at the same speed |
The right-hand column is where most teams start, because every item in it can be done this week without changing how anyone sells. The left-hand column takes longer to put in place and is the only one that moves the number.
The hardest item is the third one. A salesperson with a thin pipeline cannot afford to disqualify anything, so the cycle stretches for reasons that have nothing to do with skill. Net-New Meetings: How to Track the Indicator That Predicts Next Quarter covers how to keep enough new activity coming that walking away stays an option.
The 12-Week Playbook puts the sequence together, from establishing a baseline to picking the single stage worth working on first.
Get the 12-Week Playbook
A shorter cycle comes out of a clear read on where the time is going, not a new technique bolted onto the same process. This playbook shows how to set a baseline, find the one stage worth working on first, and tell whether the real constraint is coaching, process or talent.

Frequently Asked Questions




Ready to Build a High-Performing Sales Team?
Let's create your custom Sales Transformation Program.